Change this rotten system!
Written by: on
 Nick G
Today’s decision by the Senate to approve the Government’s three-stage tax cuts will further entrench the gap between rich and poor under this rotten system of capitalism.
Stage One will give low income earners a $530 tax rebate, Stage Two comes in on July 1, 2022 with the tax rate of 37 percent pushed out from $90,000 to $120,000 salaries.
Stage Three, to begin in 2024, will give a $7000 tax cut to those earning up to $200,000.
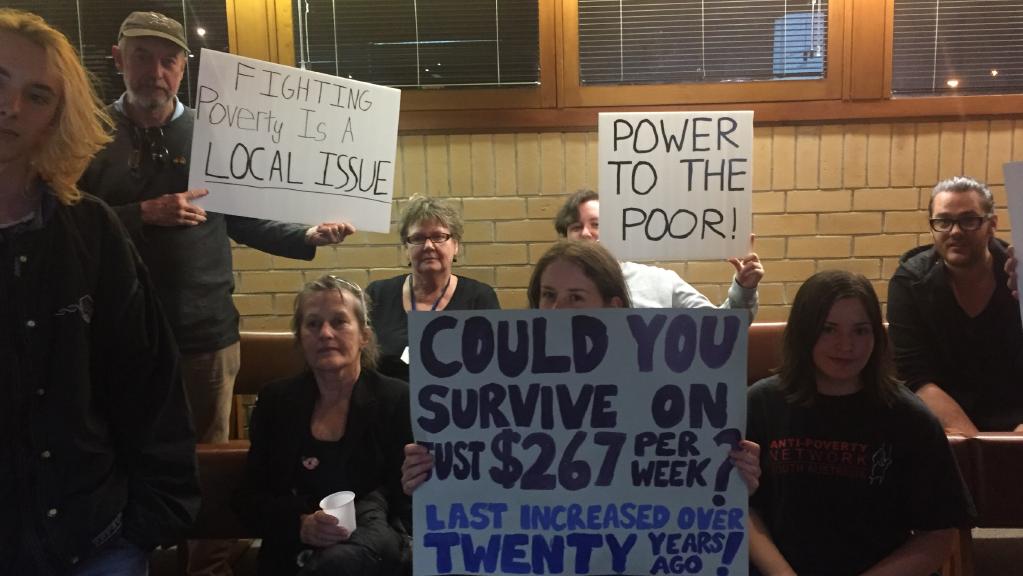
On top of this, the Government stubbornly refuses to increase the Newstart Allowance for unemployed persons, frozen at roughly $40 a day for a single person with no children for the last 24 years! (The photo shows activists from the Anti-Poverty Network in SA lobbying Salisbury Council to support a Newstart Allowance increase. Eleven local governments representing 600,000 South Australians, together with the peak national body the Australian Local Government Association, have voted to support the APN’s campaign. See “Further Reading” link below.)
And on top of this, many of the largest local and overseas corporations pay no tax year after year!
Inequality is getting worse
A study released by the Australia Institute this week concludes that inequality is getting worse in Australia with the income share of the top 10% growing at the expense of everyone else.
It quotes Australian Bureau of Statistics figures to show that over the past 20 years to 2016 all wage and salary earners have seen their share of income either fall or remain static. The only exception is the top 10 per cent of income earners who have seen their income share rise by five per cent.
Static or falling income shares do not mean that their incomes are falling in absolute terms. Incomes rose over the 20 years but the incomes of those in the top 10 per cent grew much faster than others’. The growth of the top 10 per cent was so large that the income share going to all others was static or fell.
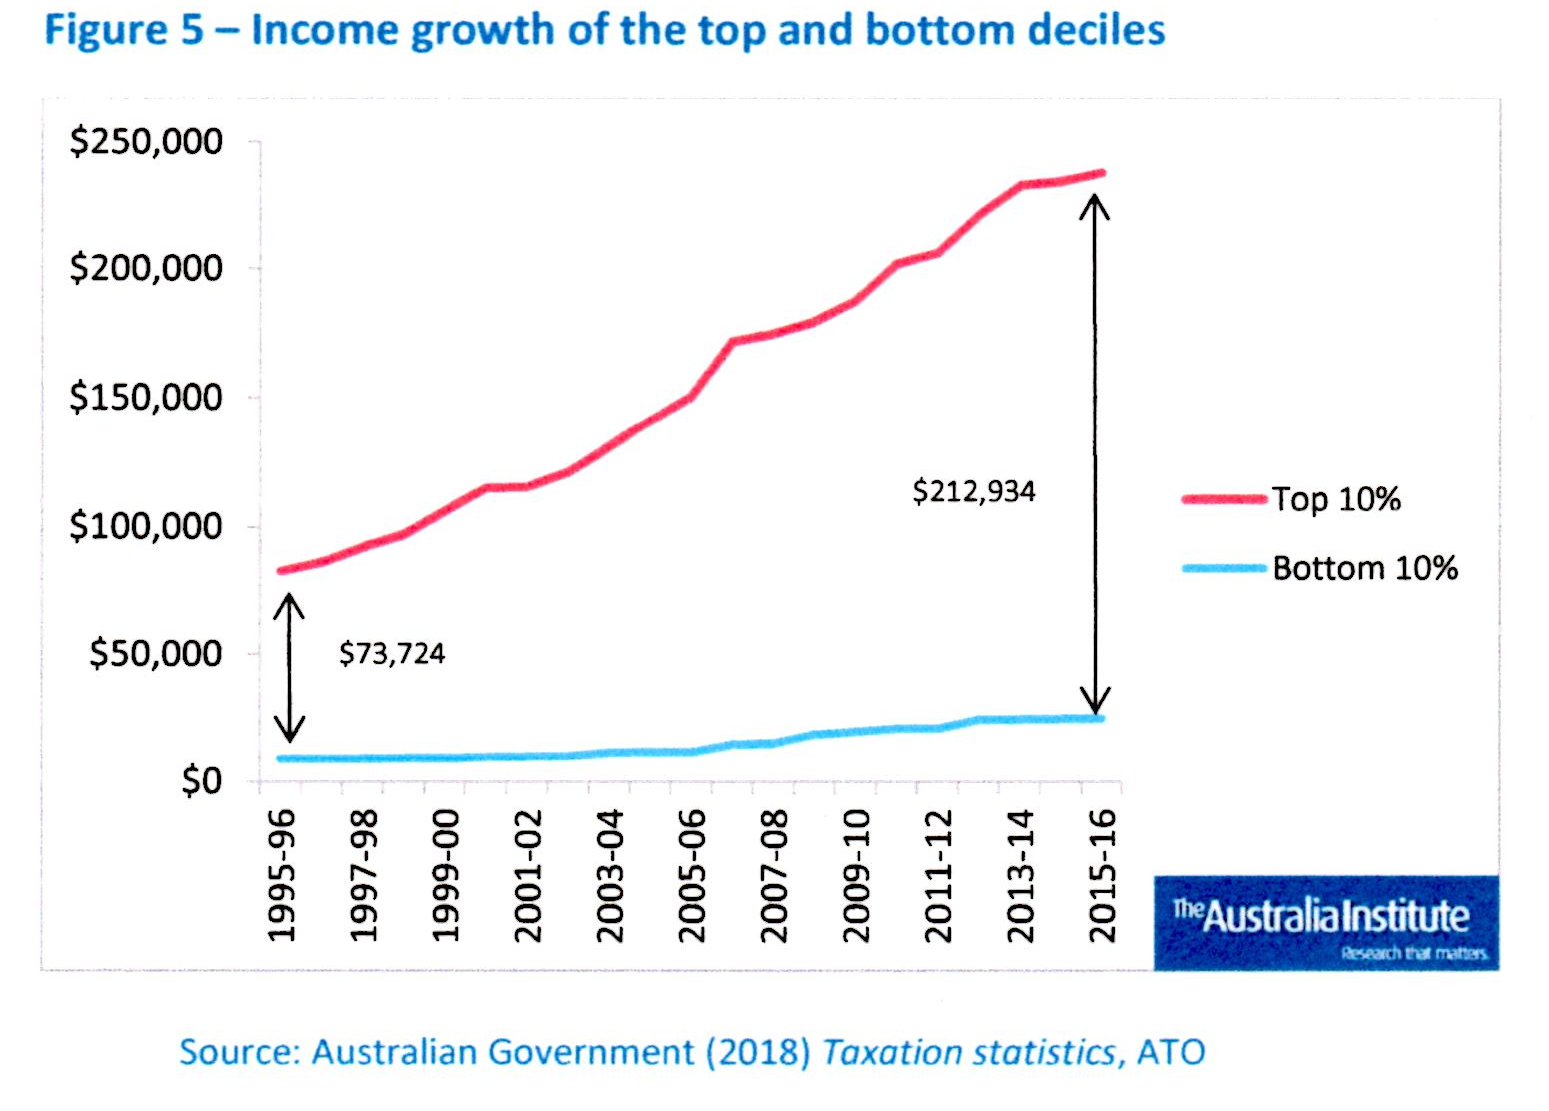
20 years ago someone in the top 10 per cent earned on average $73,724 more than someone in the bottom ten per cent. By 2016 this had increased dramatically so that someone in the top decile earned on average $212,934 more than someone in the bottom decile. This is shown in Figure 5.
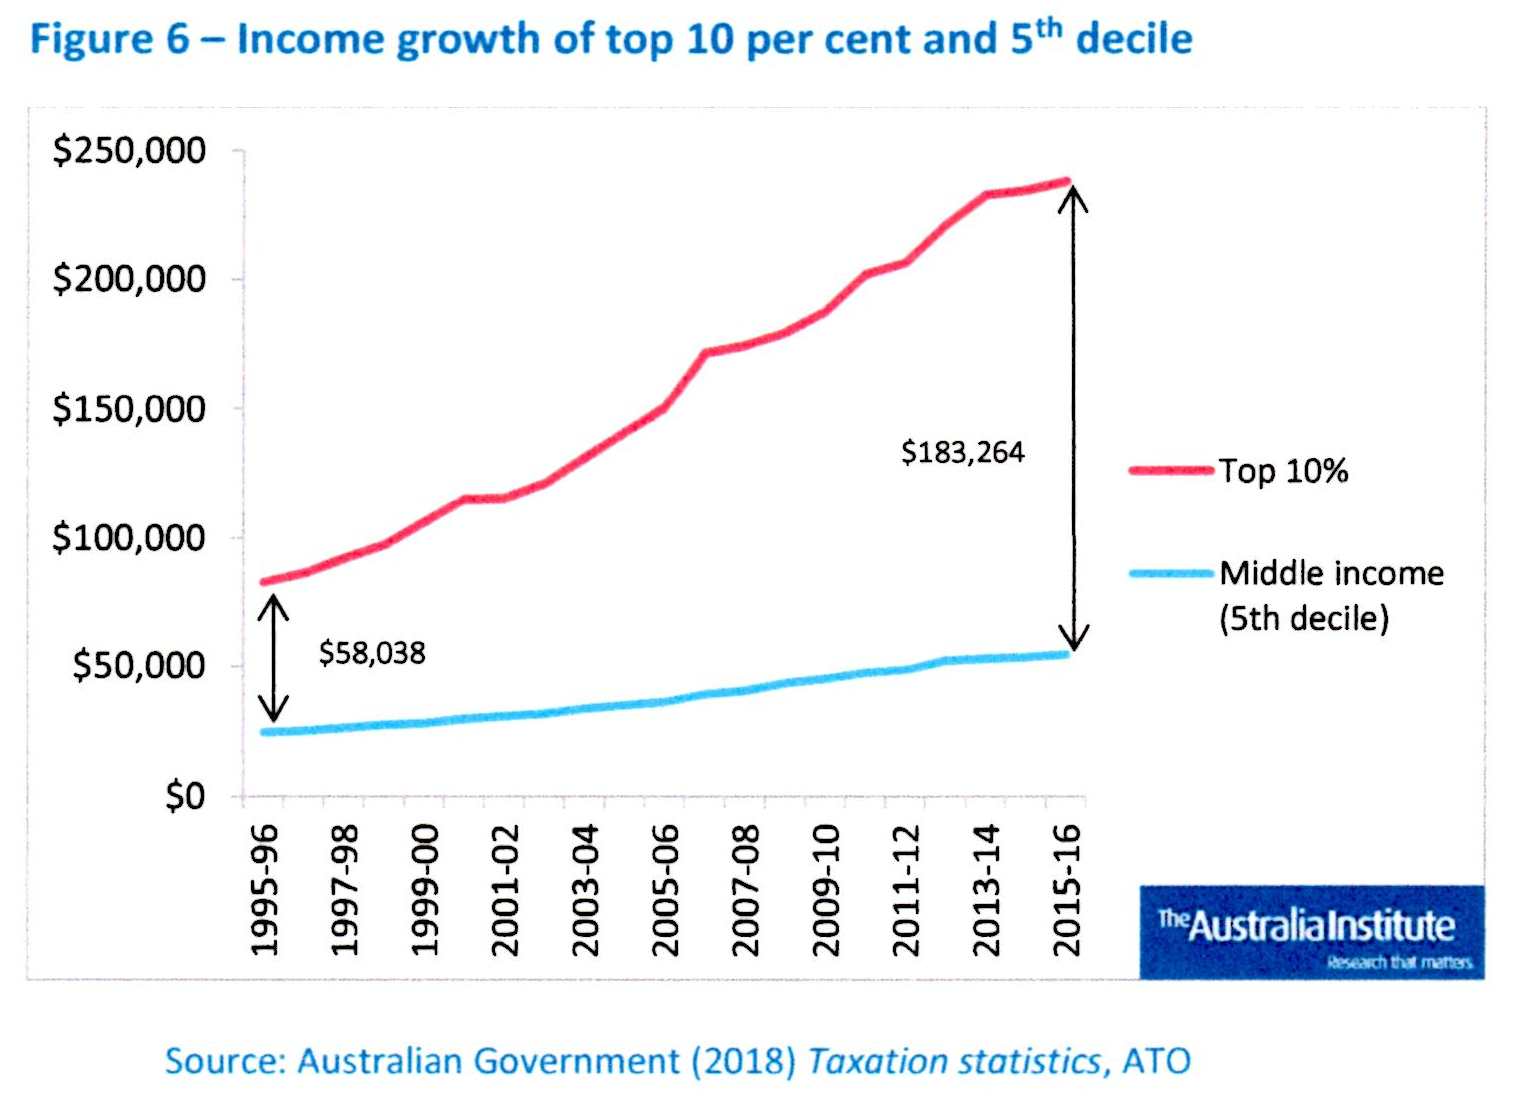
Percentage change in the income of the top 10 per cent has not only outpaced the change in the bottom 10 per cent. Middle income earners have also been left behind when compared to those at the top. Figure 6 shows average income growth of the top 10 per cent versus income growth for middle income earners (middle ten per cent).
The Gini Coefficient and some comparisons
The most common measure of inequality is the Gini Coefficient which measures inequality on a scale of 0 to 1 with 0 being perfectly equal and 1 being perfectly unequal. Wealth distribution is more unequal than income distribution. Australia’s 2015-6 Gini Coefficient for wealth was 0.605 (compared to 0.572 in 2003-4) while its Gini Coefficient for gross household income was 0.434 (compared to 0.426 in 1994-5).
Australia’s income Gini Coefficient is more unequal than the average for all developed nations. Of the 34 OECD nations, when ranked from more equal to more unequal, Australia ranks 22nd. In 2004 we were in the middle of the developed countries when it came to inequality, just below the OECD average. We ranked 17th out of 34 nations. So the growth in inequality here has been worse than in other advanced capitalist countries.
Even compared with China, whose income inequality has been universally acknowledged, Australia’s levels of inequality are looking decidedly bad.
In a paper addressing China’s economic inequality in January, Ning Jizhe, head of the National Bureau of Statistics (NBS), said that income inequality remained “relatively serious” at 0.4 in 2017, as measured by the Gini coefficient. China’s Gini coefficient has been standing above 0.4 for years, a number that is defined by UN-Habitat as an “international alert line.” According to statistics from NBS, China’s Gini coefficient reached a peak of 0.491 in 2008 and has since then dropped steadily.
It must be as plain as the nose on anyone’s face that there is a marked correlation between the years in which Australian inequality has increased and the years in which the capacity of unions to fight for wage improvement has declined. Australian unions have been gutted by legislation introduced by both Labor and Coalition governments. Workers have never been able to rely upon the generosity of bosses for wage increases. They cannot rely upon the enterprise bargaining system or the unFair Work Commission. The current campaign to Change the Rules will, if it is successful, return some initiative to unions, but the rottenness of the system will remain.
We will not tolerate growing inequality!
Change the Rules!
Change the System!
Independence and socialism!
.................................................
Further reading: Read our earlier report on the good political work udertaken by the Anti-Poverty Network here:
https://www.cpaml.org/articles3.php?id=544
Print Version - new window Email article
-----
Go back
Independence from Imperialism
People's Rights & Liberties
Community and Environment
Marxism Today
International
Articles
| Profits before People |
| Ants and Elephants: Middle Class relations with the Imperialist Bourgeoisie and the Working class |
| Aged Care Workers Win Higher Wages and Some Respect |
| Party Anniversary and Congress |
| Rising Tide Lifts All Boats |
| Closing loopholes or creating new ones? |
| The Factors of Production in Contemporary Australia |
| Pilbara Train Drivers Take industrial Action Against BHP |
| Book review - Missing the point: Alison Pennington's "Gen F'D" |
| Bosses still out to undermine Awards in changing workforce |
| Strength In Diversity - The Australian Working Class |
| Call to support US Auto Workers' Strike |
| When Workers Unite, Bosses Tremble! |
| Wage thieves don’t like new legislation |
| Working together "for the nation" is a class question |
| Trickle-down economics: double standards, rigged rules |
| Finance Sector Union Condemns Westpac Which "Lets 500 Staff Go" While Profits Soar To $4 Billion In Last 6 Months! |
| Class struggle works two ways |
| “Same Job, Same Pay” Bill Tinkers At The Edge Of Wage Swindles |
| Annual wage review reveals declining living standards of the working class - sets the scene for big struggles ahead |
-----